
 |
The program is launched by the command
java -jar midv.jar -f datafile [-molname] [-nsi n] [-dvp file] [-xaxis name] [-yaxis name] [-colorby name]
Molinspiration DataViewer requires data in a specific format. Data file should contain lines starting with molecule SMILES followed optionally by molecule name and then by text and numerical values. All data items must be tab separated. The first line of the data file should countain names of the used parameters (the line must start with a text SMILES).
If a molecule name is present in the data, it must be a first item after SMILES. In this case the parameter -molname must be used when invoking the Viewer. The name will be then shown together with the molecule when pointing with mouse on respective point in the graph.
Additional text items must follow SMILES and molecule name. If any text data are present, parameter -nsi n (where n is the number of text items) must be used when invoking the Viewer (otherwise the program tries to parse the text as numerical parameter, which, of course, causes an error).
Parameters -xaxis itemName and -yaxis itemName determine which data items will be displayed after start of the Viewer. Parameter -colorby itemName determines which parameter will be used for intial point coloring.
With parameter -dvp file additional Viewer parameters may be provided.
Data files in required format my be prepared by any program (for example by Excel) but the Molinspiration cheminformatics package mib is recommended.
Download a set of molecules (232 common drugs) from the Molinspiration web site. This file contains molecule SMILES codes and molecule names, tab separated.
smiles name CNCC(O)c1ccc(O)c(O)c1 adrenaline C=CCc1ccccc1OCC(O)CNC(C)C alprenolol Cc1ncsc1CCCl clomethiazole . . . |
Now we will calculate a set of properties for these molecules by the mib toolkit.
Use command:
java -jar mib.jar -f molecules.txt -properties -header > molecules.props
The file molecules.props now contains our molecules plus 8 molecular properties (logP, molecular weight, polar surface area ...). The file contains also a descriptive header (which we required by the -header parameter in the command line).
So we have now data in this form
smiles name miLogP TPSA natoms MW nON nOHNH nviolations nrotb CNCC(O)c1ccc(O)c(O)c1 adrenaline 0.809 72.711 13 183.207 4 4 0 3 C=CCc1ccccc1OCC(O)CNC(C)C alprenolol 2.861 41.489 18 249.352 3 2 0 8 Cc1ncsc1CCCl clomethiazole 1.933 12.892 9 161.649 1 0 0 2 . . . |
Let's launch midv to have a look at the data.
java -jar midv.jar -f molecules.props -molname
We had to use the option -molname since the data file contains a molecule name after SMILES.
You should see this.
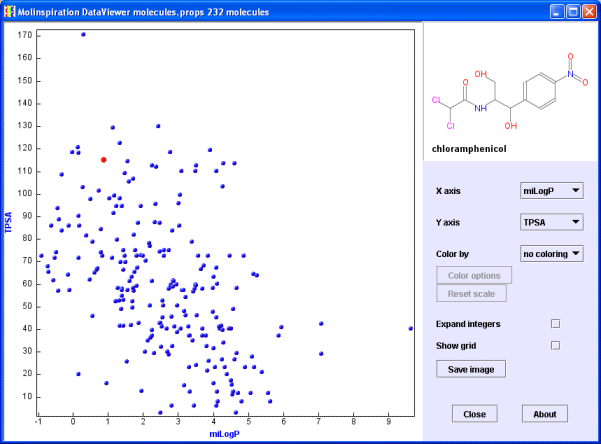
If you have problems launching the midv, or you are getting an error message, check whether Java is available on your computer (ask your local Java guru), or check whether your data are in the correct format required by the midv.
Move mouse over the data points, you will see respective molecules in the molecule window. Molecular images are generated on the fly from SMILES.
Try now to change properties on x and y axis with help of the respective 'X axis' and 'Y axis' pop-up menus.
If you display two "integer" properties, such as the number of hydrogen bonds donors (nOHNH) and acceptors (nON) (as on the image below), most of the points are obsured by each other.
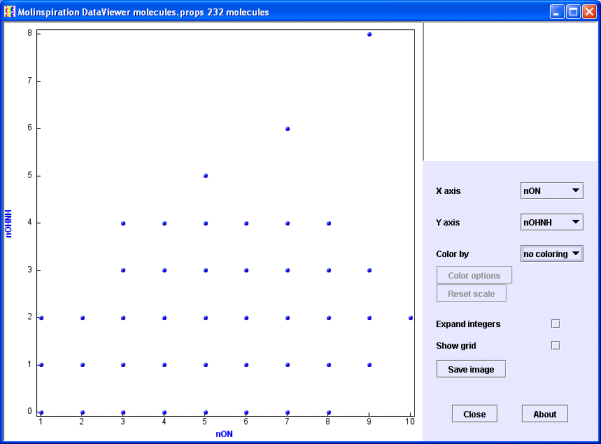
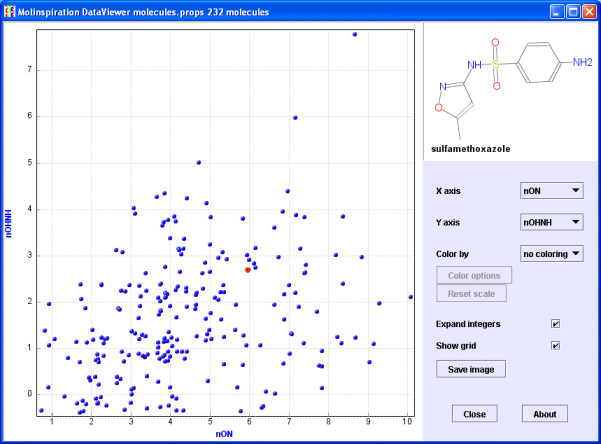
Check now the 'Expand integers' box. Property values will be slightly "scattered" around their base integer values. This view has much better information content than the previous one. You may check also the Show grid checkbox.
Choose again the view with miLogP (Molinspiration logP value) and TPSA (polar surface area) properties. Now open the 'Color by' popup menu and select 'nviolations' (number of Rule of 5 violations). Molecules are now colored by the selected property.
Press the 'Color options' button. You will see the current ranges for the colors.

Edit this menu according to the example below (choose 'nlevels' 3, change colors with help of the color pop-ups, and edit respective border values) and press the 'Apply' button.

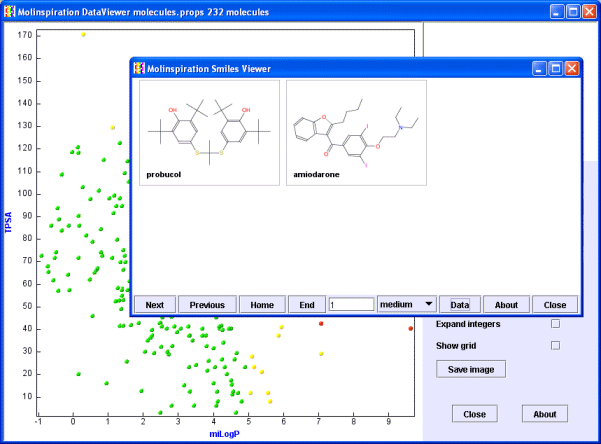
Molecules with 0 violations are now green, with 1 violation orange, and with 2 violations red.
TIP You may choose the white color to temporarily make molecules "invisible".
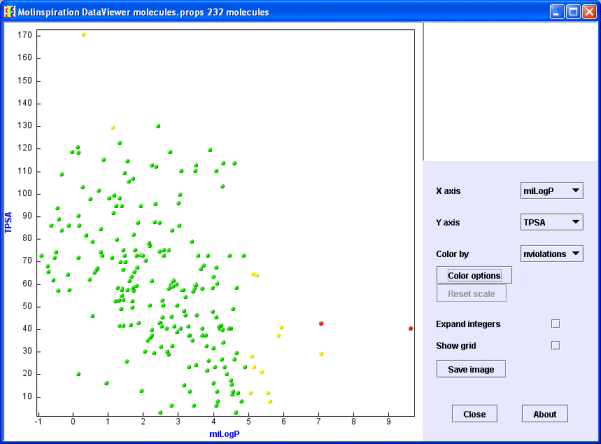
Now select the 2 red molecules by dragging mouse around them (you will see the selection box) while keeping the Shift key pressed. When you release the mouse button (still keep the Shift pressed) the Molinspiration Molecule Viewer will be launched with the selected molecules. Press the 'Data' button on the Molecule Viewer to see also molecule names.
When selecting molecules without pressing the Shift key, the scale of the graph is changed, showing only the selected area. You can reset the scaling by the 'Reset scale' button.
And the last option. Press the 'Save image' button, and the image of the graph area will be saved into your working directory as a png image with name midv.png. You can export it into your Word or Powerpoint (or maybe StarOffice) presentations.
Have fun ! And do not hesitate to contact Molinspiration if you have additional questions or would like to test the software.